
Garage Phase 2 – HVAC monitoring
In Part 2, I discussed installing a Pioneer mini split in my detached garage. In that post, I mentioned that the Cielo app that went with the Pioneer Smart Controller I installed in the mini-split fell short of my expectations of what I was able to see in terms of mini split usage over time. It’s not that the app didn’t have history of usage stats, it’s that with me keeping the mini split in freeze protection mode, the usage stats weren’t being collected at all. I think it’s considered more of a maintenance mode rather than active usage. I had expected something similar to what I was getting with my Nest thermostat with a usage graph but I just get “No usage” for ever single day even though I know it has been running.

From here, I set out to come up with a way to monitor the usage history myself. I wasn’t exactly sure how I was going to do this. I thought of pointing my Wyze cam at it and watching for when the vent on the bottom was open vs. closed. But, I knew for sure that the vent was still open even when the heat was off. Changes in how much it was open might be too subtle to detect. This approach seemed way too difficult.
I have long had a Raspberry Pi version 2b with OpenHab running on it for home automation needs; controlling lights and so on. I also had integrated into it some old Oregon Scientific temperature sensors. They are the type where you have a temperature base station with a display for the current temperature and the ability to have remote temperature sensors which communicate wirelessly back to the station.
These remote sensors communicate via RF back to the base station and I found that it was possible to get an add-on board for the Raspberry Pi to receive those same signals. With a little programming, it was possible to capture and decode those broadcasts and to log them to a database on the Raspberry Pi. I did this project several years ago so I already had everything in place. I might actually cover that setup in more detail in a future post.
I reorganized my raspberry pi setup a bit and started to collect both outdoor and indoor (garage) temperature and to save the values every minute. In realtime, I can view the current temperature, humidity and battery status of each sensor right in the OpenHab app. And, I can also see a chart of historical temperature values over different time periods.
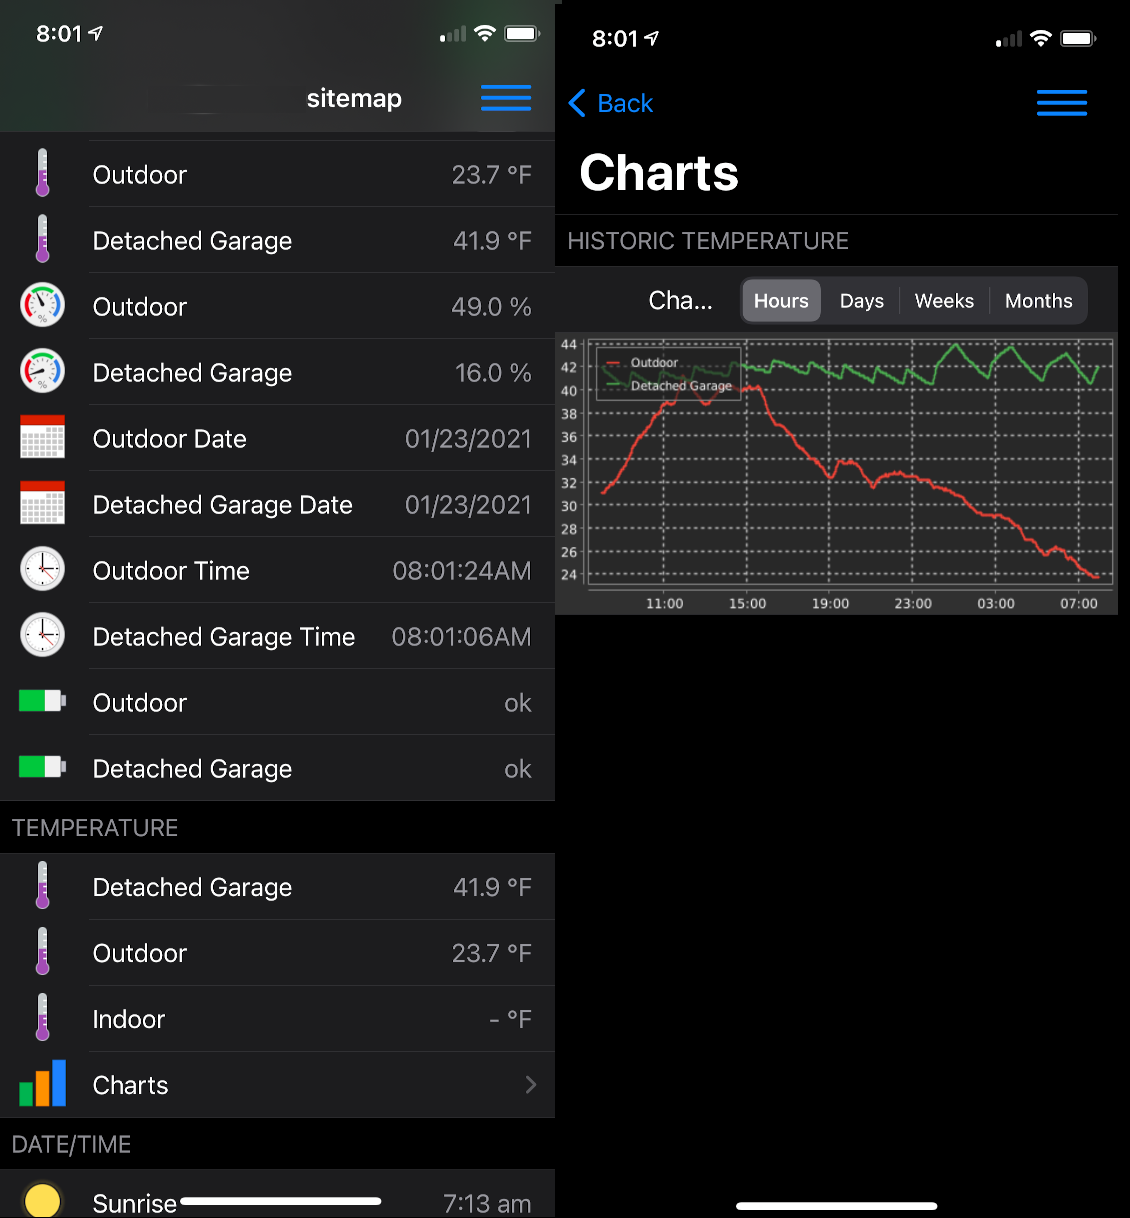
The result was somewhat surprising. I was clearly able to see a sawtooth pattern in the garage temperature. Visually, it was pretty easy to tell when the mini split was heating and when it was not. At this point, I was pretty sure I could write an algorithm to calculate when the heat was rising and when it was falling. And, I could hold that trend data against the outdoor temperature as a further verification of a temperature rise due to heating. And, conclude from this how often the mini split was running.
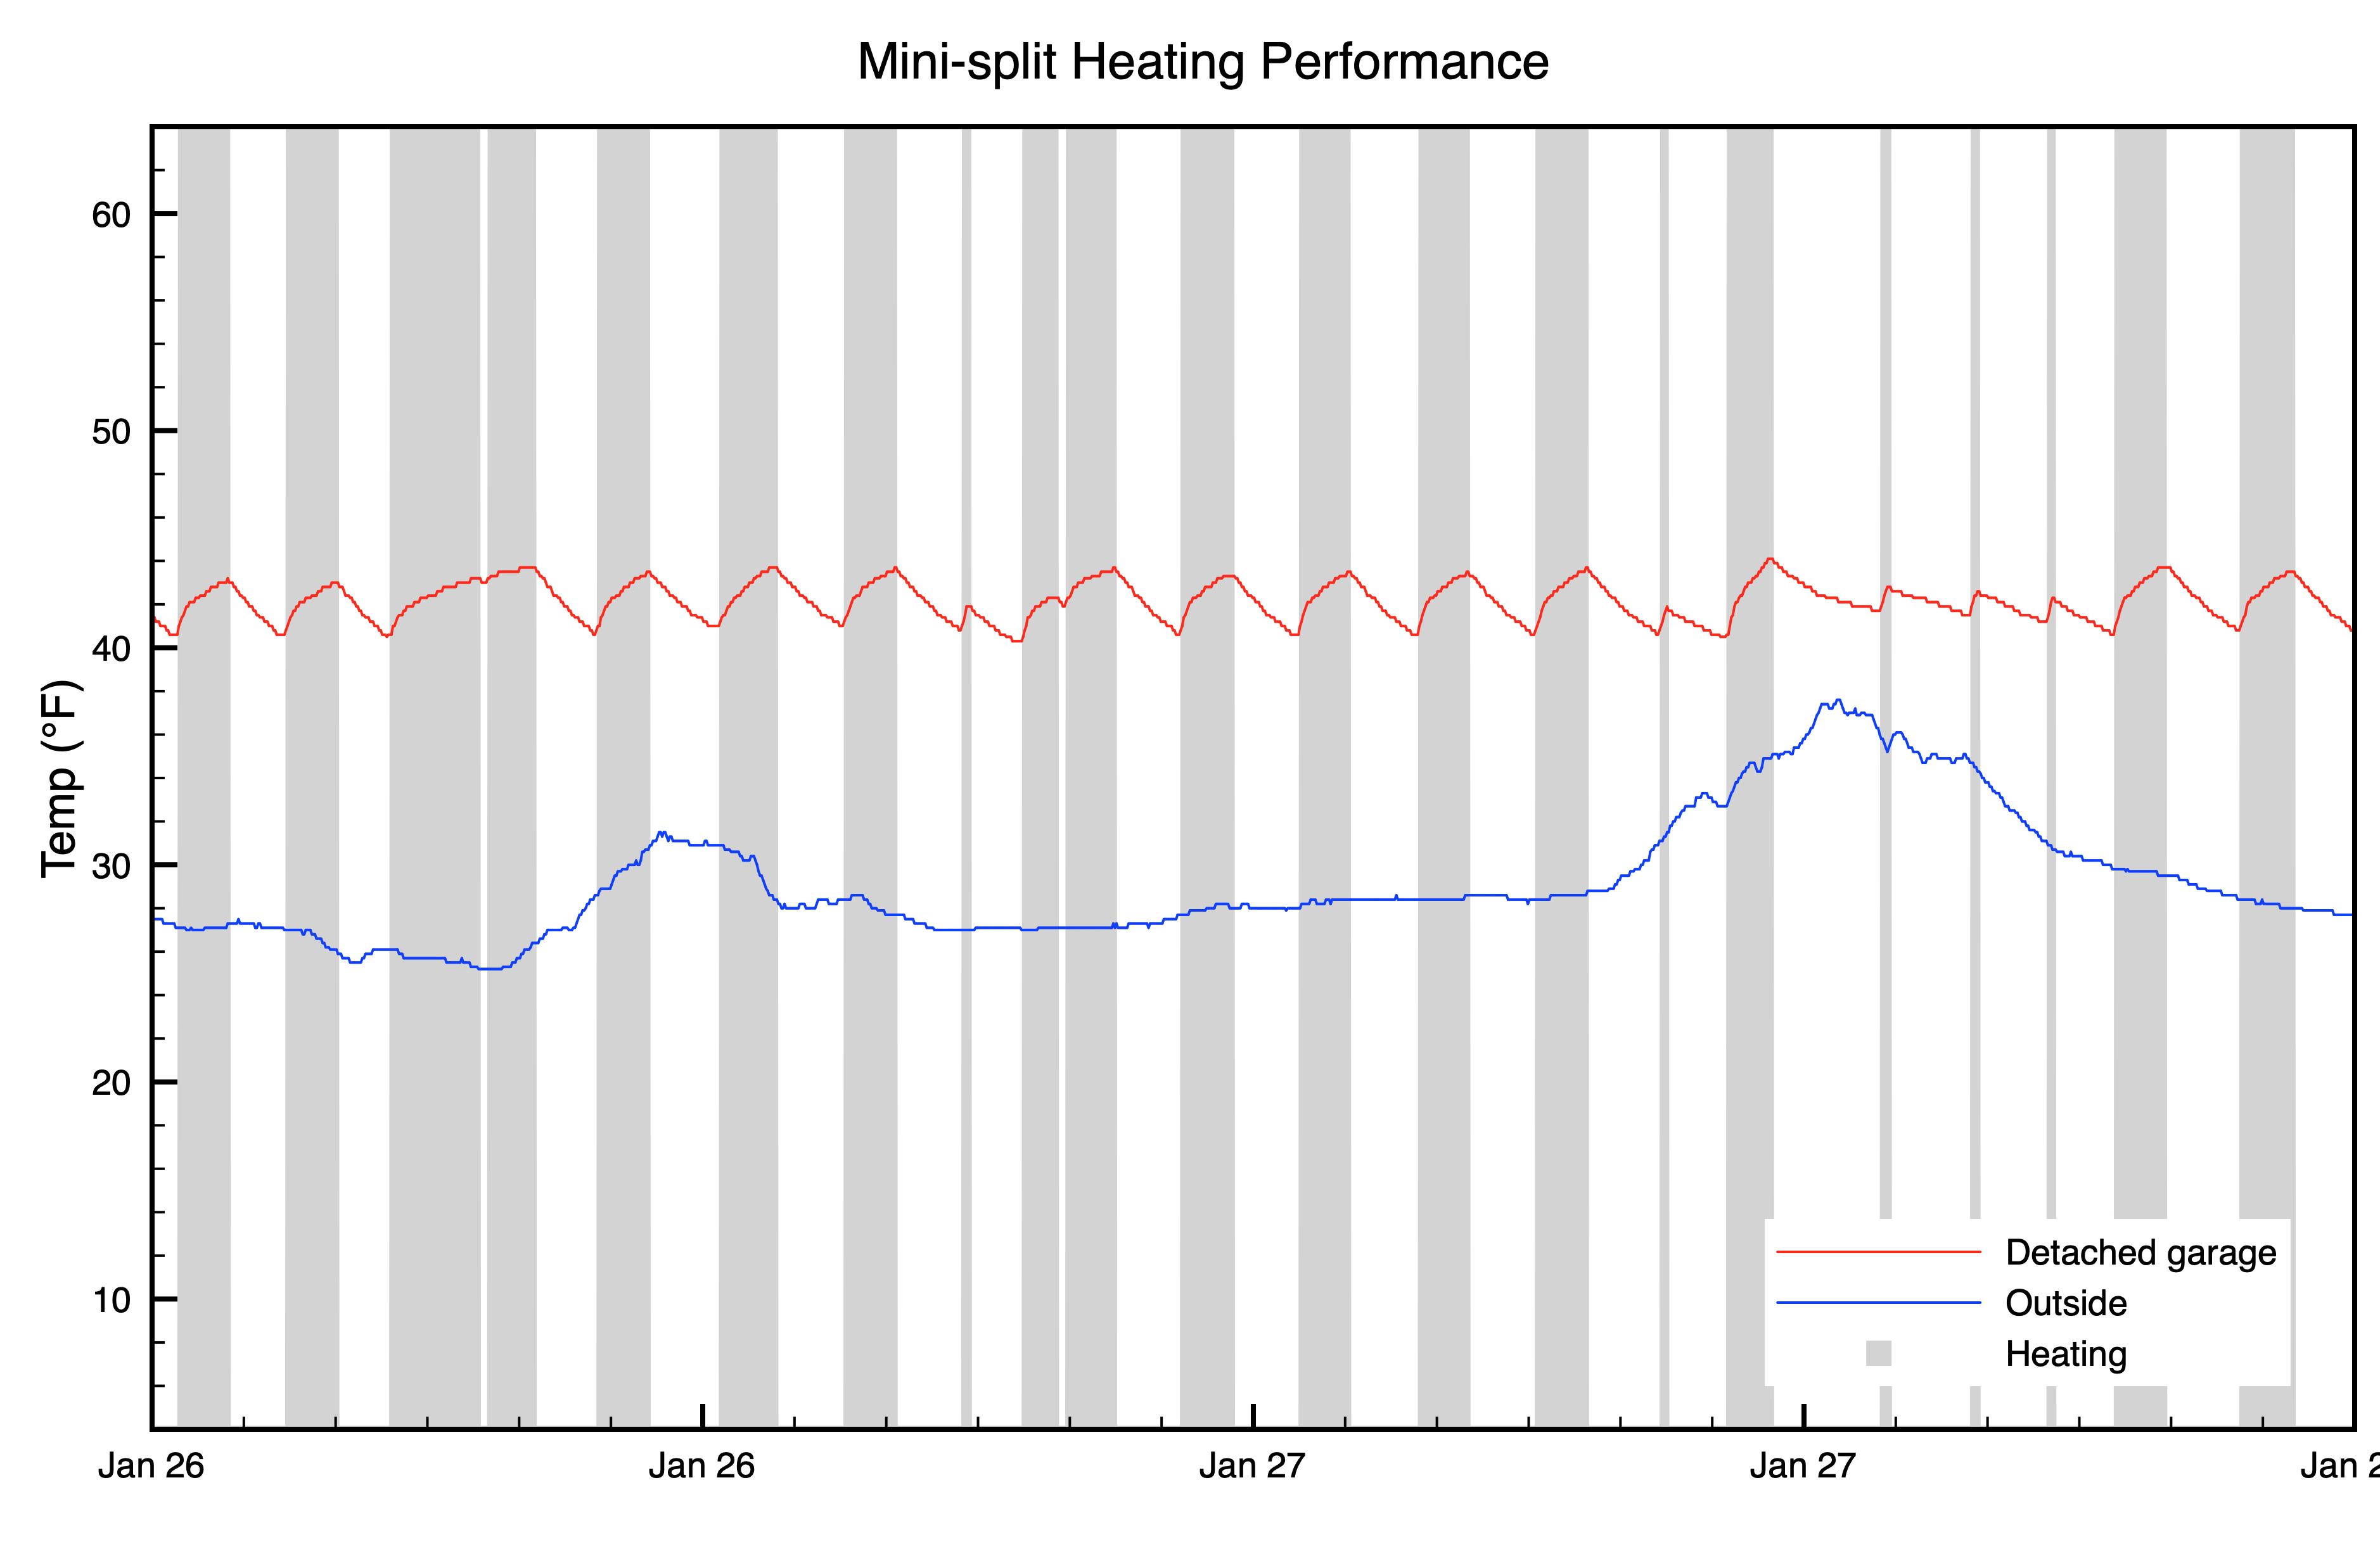
Since the OpenHab charting features were a little more basic than I needed, I exported all of the raw temperature data and used the Plot2 application on MacOS to graph it. The result was pretty neat. I could definitely see the cycling of the mini split to keep the temperature at 46°F. The temperature sensor is physically a few feet away from the mini split and a little below it so I think that accounts for the difference in the temp being maintained at what appears as slightly under 46°F, the freeze protection setpoint.

From here, I then brought the same data into Excel and worked on my algorithm to figure out when the heat was on. Since I had data on a minute-by-minute basis, I was able to determine if the heat was on for each minute-by-minute interval. I was able to overlay the heat data onto the original plot in order to visually verify that my algorithm was accurate and I was correctly capturing the heating periods corresponding with the rise in temperature.
In general, I thought my algorithm was doing pretty good. There are a few minutes missed here and there. I will definitely revisit it to do more tuning once I have more data. With the data in Excel, I then created a pivot table to compare hours of heating per day with the average outdoor and indoor temperature. I also plotted that data.

A pretty cool observation from this is that, as might be expected, the demand for heating is nearly exactly inversely related to the outdoor temperature.
II was also interested in determining any impact on electricity costs related to heating the garage. While I hadn’t started capturing the minute-by-minute temperature data until the end of December, I had starting running the mini-split in late November. I even had used it to heat above the temperature set by freeze protection mode in late November while I finished work in there. So, I set about to next figure out how much more I was paying in electricity.
To do this, I went back to my historical data for electricity usage. Comparing the average kWh used per day for the two months that the mini split had been in use (December and January) to what I had captured for the preceding 10 years, I was able to observe the following trend data.
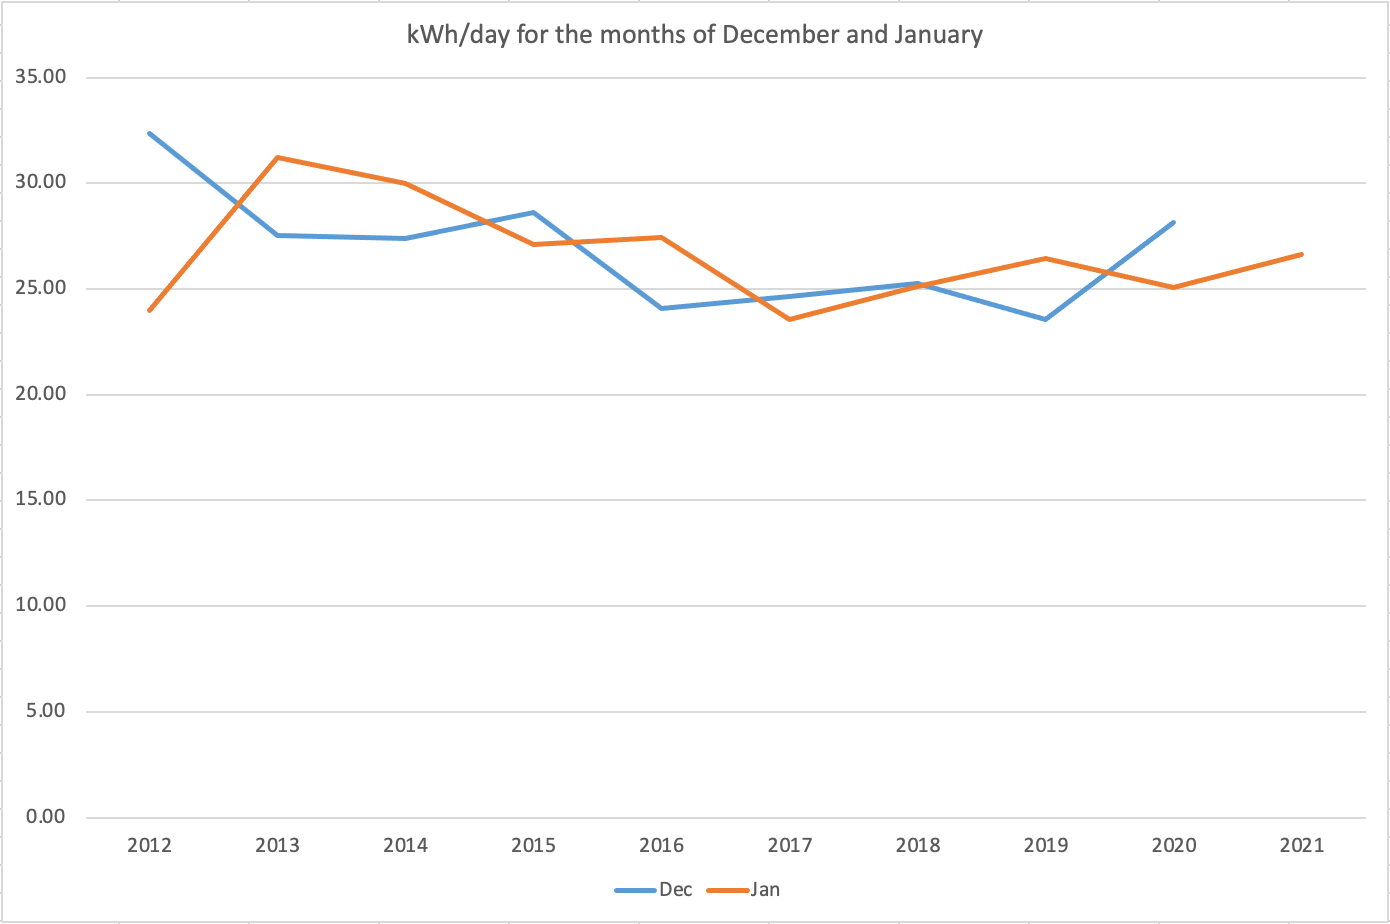
This data spans many different usage impacts in our home; conversion from CFL to LED lighting, switching from old school thermostats to the Nest Thermostat, the addition of gaming desktops, and more including an increase in our electricity usage due to the pandemic. Simply put, we are home more often. Clearly there has been an increase with the addition of the mini split, but not so dramatic that I am really worried about it as it did not put us at all-time highs.
To take a different view of this, I looked at the delta in average daily usage per month between the last 15 months each compared to the same month of the preceding year. This picture also does not show me anything alarming about the electricity usage added by the mini-split.
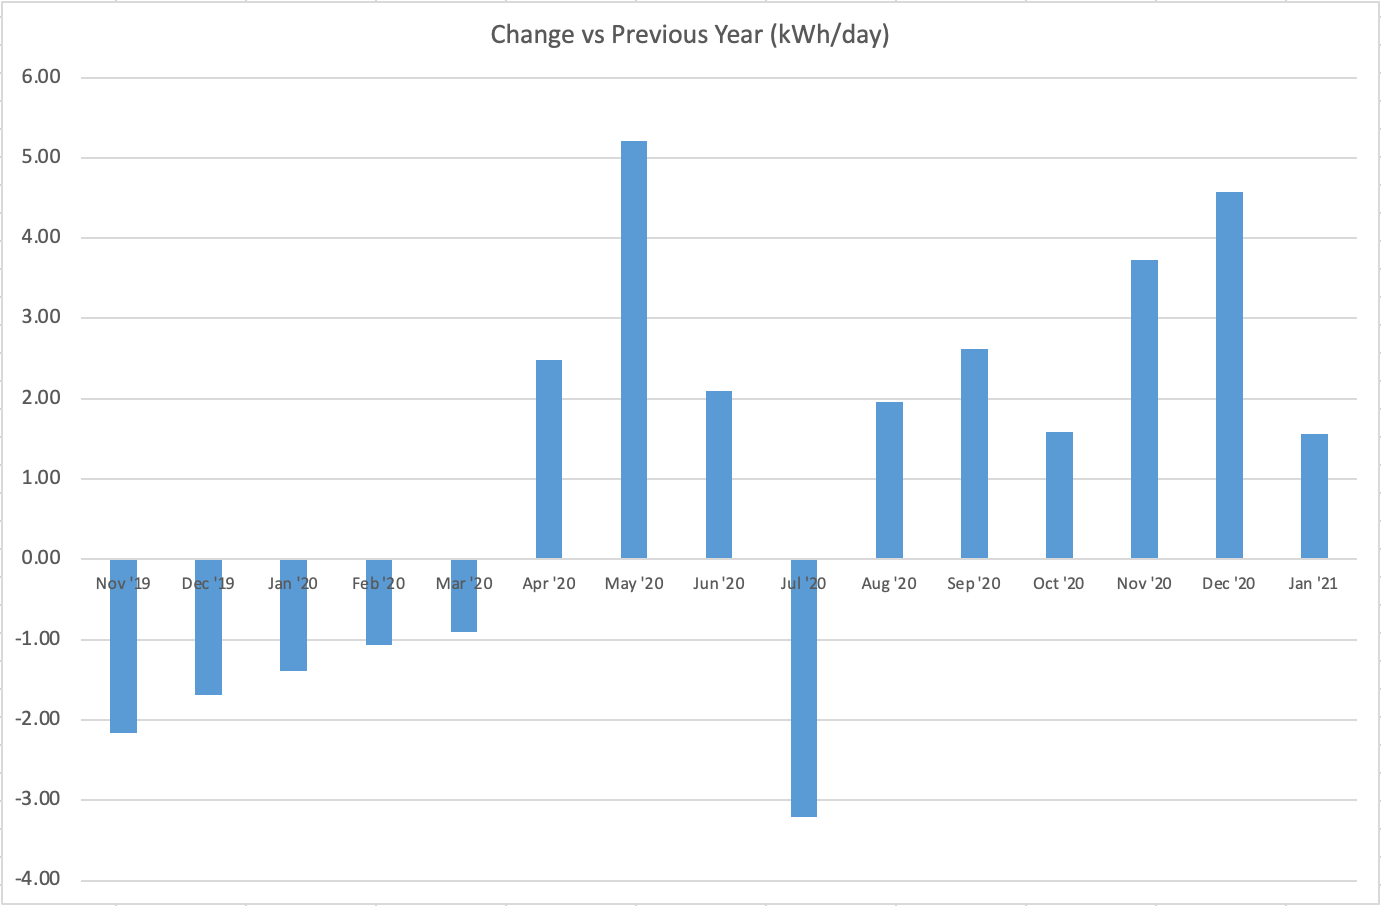
What it does show is that in late 2019 and early 2020, we were on a good path with each month showing a decrease in usage vs. the same period of the preceding year. That is until the pandemic hit in March and we were all at home. Note that July is always a wild card as cooling is a major contributing factor to our electricity use so I just view this anomaly in July as attributable to less A/C usage. Without July, the latest usage numbers for the last two months with the mini-split are not that out of line with the proceeding 7 months.
All things considered, I’m actually pleased with the limited impact that the mini-split has had on our electricity usage. As, I conclude this post, we are now in one of the coldest periods of our winter thus far. We’ve been seeing temps in the teens and single digits for a few days. I think my next post will be on this more severe cold weather performance of the mini split after I capture some more data.
What I used for this project –